2.19 Using web-browser diagnostics to find configuration errors.
For more examples, see also section 14.3 - Development tools
Web Browser Inspect element facility
This is a right mouse option on most web browsers.
It is particularly good on Firefox developer and Chrome.
It provides a huge amount of information on traffic to and from websites.
It has very useful debugging facilities.
Its most useful application is in examining Ajax requests to the RPi server and the resulting responses.
Additionally, if there is an error in the server PHP code which is processing the request,
the PHP system echos back a detailed error message containing the location of the problem.
If you can't interpret it, then you can always send a copy to me / user group.
Example of incorrect Smeter configuration (as in the video!)
Problem simulation: Illegal command syntax - A common problem during configuration.
Using Transceiver-H-C with FTdx101D:
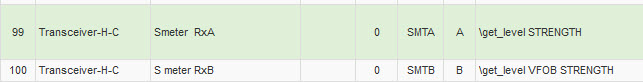
I deliberately introduce an error into table meterhl:
- I omitted the VFOA parameter from S meter RxA readmask
ie: \get_level STRENGTH instead of \get_level VFOA STRENGTH
This causes the piWebCAT to repeatedly stop for 2 seconds or so and display the following:
![]()
The message clears and activity resumes briefly and then the message appears again.
Whats is happeing? ... The RPi server PHP code is sending an illegal meter read to Hamlib rigctld.
The server awaits the meter reading response but it never arrives.
My server PHP code has a two second timeout.
The PHP process sends back an timeout message and then self aborts.
The client code displays the error message on the screen.
We need a method of identifying which of the stream of repetitive commands is causing the problem.
With piWebCAT running, use right mouse inspect element (Q)
( ... You may have to enlarge the window downwards.)
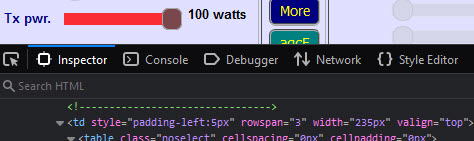
The display will include the above.
Click the Network tab
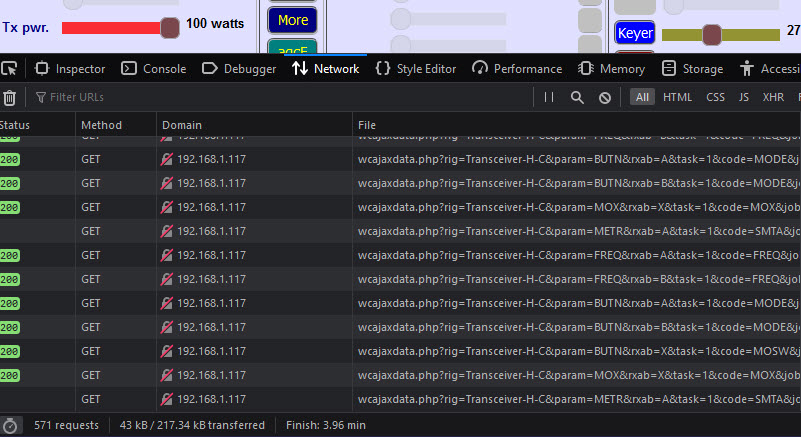
You see a scrolling display of the stream of messages from client to server.
The scrolling keeps briefly stopping ..... on the bottom item of the stream.
You can, if you wish, halt input to the list with the pause button at the top.
-- so long as you capture the item on which the stop occurred.
Examining the bottom item reveals: ...param=METR&rxab=A&task=1&code=SMTA ....
param=METR is the job type, rxab=A means meter for VFOA,
task=1 means read, code=SMTA is the client - server link code from the meterhl table.
So - we have identified the problem as occurring in S meter reading
- This should direct you in the first instance to the table where we deliberately created the error.
More....
While we are here .... I have paused the scroll ... we can examine some of the other items in the stream.
If I highlight an item, the window narrows and hides the detail but a second window appear to the right.
I click the headers tab . I can now see the detail of the request again ...
I had selected a frequency read item:
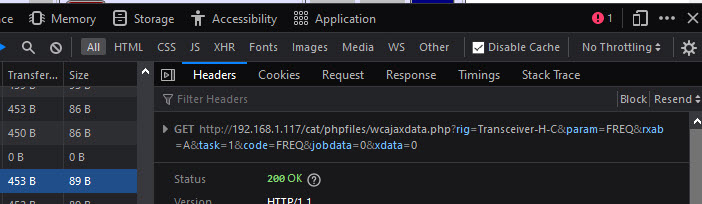
You can see param=FREQ raxb=A task=1 code=FREQ
This is a timer driven command to read VFOA frequency - which is performed correctly.
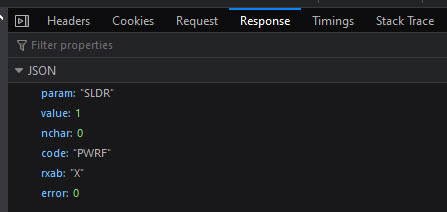
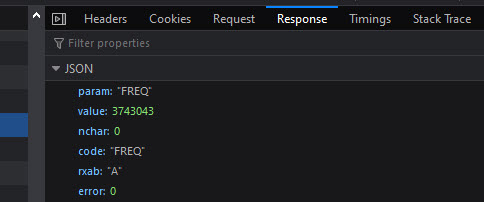
If we switch from the headers tab to the response tab, we see the correct response:
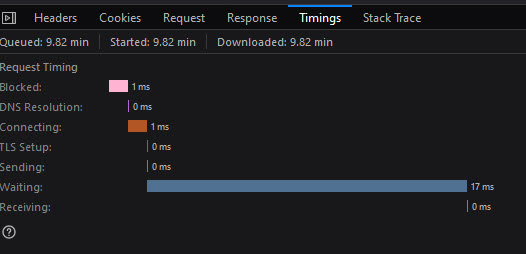
The timings tab shows the timing for the command.
Another example - RF power reading
This is occurring repetitively in the background because I have set the RF power slider with active=S (sync)
in order that the slider is kept up to date with the corresponding value on the rig.
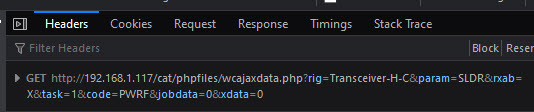
The response shows a returned value of 1 (This is 100w ... the data range is 5 to 100w)
I have suggested using rigctl at the RPi command line to check data ranges.
This is perhaps another way of doing it!